
PPDA stands for "passes per defensive action," and it measures how intensely a team presses the opponent before they can settle into possession. The formula divides opponent passes completed in the pressing zone by the number of defensive actions attempted there. A low number signals an aggressive, high-intensity press. A high number indicates a team more inclined to sit back. Wyscout, StatsBomb, and Coaches' Voice all track versions of this stat, and it shows up constantly in match analysis and post-game breakdowns.
Key Takeaways
PPDA measures pressing intensity through a simple ratio, but it requires video review and complementary stats to judge whether that pressing actually works.
| Point | Details |
|---|---|
| Core formula | Divide opponent completed passes in the final 60% zone by your team's defensive actions there. |
| Low number, high intensity | Values near 7 to 10 usually signal an aggressive, high-press system. |
| Provider variance matters | Compare PPDA only within the same data source, since StatsBomb, Wyscout, and Hudl count events differently. |
| League benchmark | The top five European leagues averaged an 11.01 PPDA in the 2018/19 season. |
| Pair with other stats | Combine PPDA with xG, turnovers won, and possession share for a full tactical picture. |
Table of Contents
- What Is PPDA and Why Was It Created?
- How Is PPDA Calculated?
- What Do Low and High PPDA Values Mean?
- What Are the Limitations of PPDA?
- What Do Typical PPDA Numbers Look Like?
- How Do You Calculate PPDA From a Real Match?
- How Football Planet Helps You Track Pressing Stats
- Where PPDA Fits in Modern Tactical Analysis
- Frequently Asked Questions
- Sources
What Is PPDA and Why Was It Created?
Analysts needed a fast way to describe pressing without watching 90 minutes of tape, so PPDA translates that pressing effort into one number: passes allowed divided by defensive actions taken.
Here's the key distinction most casual fans miss: PPDA measures intensity, not effectiveness. A team can press like their season depends on it, and still get carved open. PPDA won't tell you that on its own. It tells you how often a team chases the ball high up the pitch, not whether the chasing actually works.
- Intensity = frequency of pressing attempts in the target zone.
- Effectiveness = whether those attempts actually recover the ball or force a mistake.
Pro Tip: Treat PPDA as a conversation starter, not a verdict. When a number looks extreme, cross-check it against video before drawing tactical conclusions. Both Coaches' Voice and Wyscout frame it this way, and it's the right instinct for any fan trying to read a box score.
How Is PPDA Calculated?
The formula is straightforward once you see it written out:
PPDA = Opponent completed passes in the target zone ÷ Defensive actions by the pressing team in that zone
The "target zone" isn't the whole pitch. Anything that happens deep in a team's own defensive third gets excluded, because that's not really pressing, that's just defending your box.
Which events count as defensive actions? Most providers include:
- Tackles (successful or attempted)
- Interceptions
- Challenges and failed tackle attempts
- Fouls committed while pressing
The Premier League's own explainer confirms this zone definition and event list, and it's the version most broadcasters lean on.
Here's where it gets tricky for anyone building their own numbers: providers don't all count identically. StatsBomb and Hudl implementations sometimes fold in extra events like dribbled-past incidents or blocks, depending on how their event-query is written, according to Hudl's support documentation. Wyscout's coordinate boundaries can differ slightly from StatsBomb's too. The practical takeaway: never compare a Wyscout PPDA figure directly against a StatsBomb one. Compare within the same data source, or you're comparing apples to a slightly different fruit.
What Do Low and High PPDA Values Mean?
A low PPDA number usually means a team is pressing high and often. Watch for these signs on the pitch:
- Forwards and midfielders closing down center backs almost immediately after a goal kick.
- A compact team shape that squeezes the pitch vertically.
- Frequent fouls committed high up the field as players try to disrupt buildup play.
A high PPDA tells a different story. The team is likely sitting in a mid block or low block, inviting the opponent to have the ball and waiting for a trigger to engage.
- Defenders and midfielders holding position rather than chasing.
- More time in a defensive shape, less time sprinting to close gaps.
- Often paired with lower overall possession share.
Don't read PPDA in isolation. Cross-reference it with possession percentage, turnovers won, and passing network maps before deciding what a team's identity actually is.
What Are the Limitations of PPDA?
PPDA has real blind spots, and ignoring them leads to bad tactical takes. The biggest one: possession bias. A team that dominates the ball naturally faces fewer opponent passes to disrupt, which can flatter their PPDA number even if their press isn't especially sharp.
Other gaps worth knowing:
- It ignores off-ball pressing runs that force a bad pass without ever registering a tackle or interception.
- Failed tackle attempts count the same as successful ones, so a team hacking wildly at ankles can look "intense" without winning anything.
- It says nothing about where on the pitch the ball was actually won, or how dangerous that recovery was.
A dominant possession side can post a flattering PPDA purely from control, not smart pressing. Meanwhile a team throwing bodies at every duel and losing most of them can post the same low number for the opposite reason. According to Total Football Analysis, PPDA measures pressing intensity, not pressing quality, and that distinction should guide every read of the stat.
Pro Tip: Pair PPDA with turnovers won in the final third, pressures leading directly to a turnover, and opponent pass completion in that same zone. Together they separate "presses a lot" from "presses well."
What Do Typical PPDA Numbers Look Like?
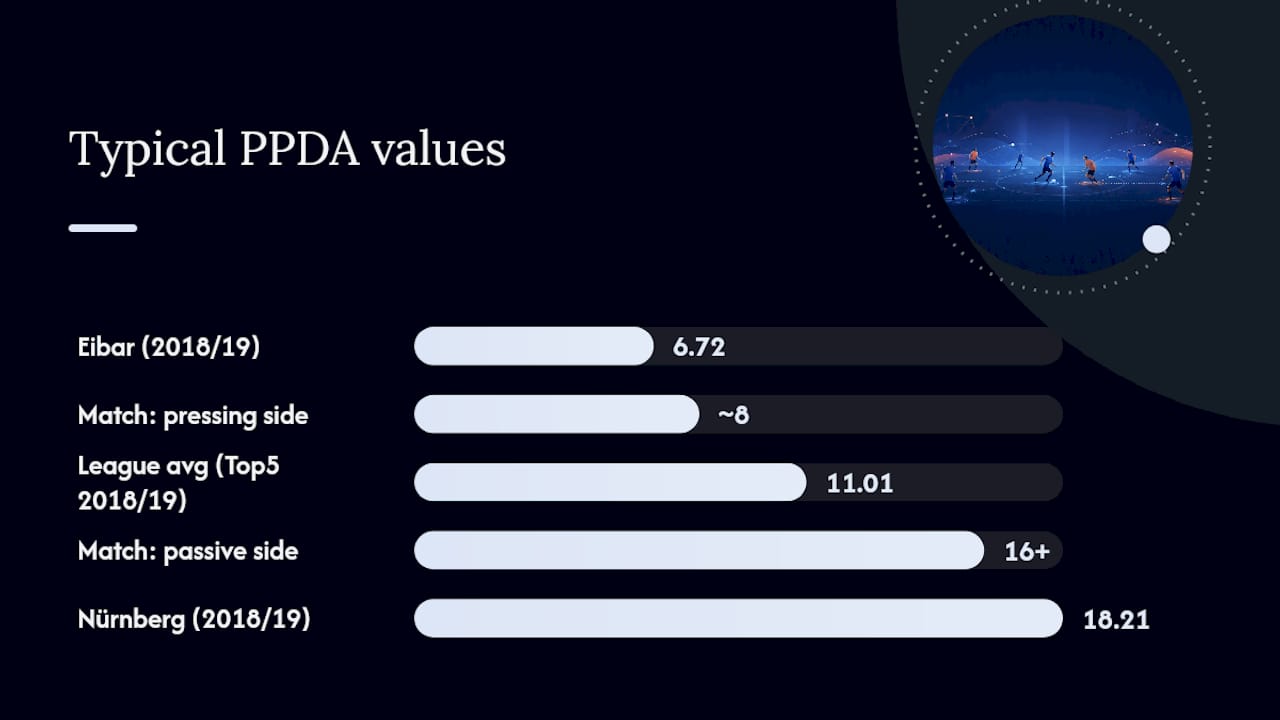
Season-long benchmarks give the number real meaning. Across Europe's top five leagues in 2018/19, Wyscout recorded a league average PPDA of 11.01, with Eibar sitting near the aggressive end at 6.72 and Nürnberg near the passive end at 18.21. That range, roughly 7 to 18, is a useful mental scale whenever you see a new number pop up.
Match-to-match swings can be dramatic too. In a single fixture, one side might press at a PPDA near 8 while the opponent sits back at 16 or higher, even though both teams are competing for the same three points. A Liverpool vs Manchester United matchup is a good mental model here: Liverpool's pressing sides under recent regimes have often posted markedly lower PPDA figures than a United side content to absorb pressure and break quickly.
- League averages cluster loosely between 10 and 12 across most major competitions.
- Single-match figures swing far wider than season averages, so don't judge a team off one game.
- Always confirm which provider generated the number before comparing it to a benchmark from a different source.
How Do You Calculate PPDA From a Real Match?
Building a PPDA figure from scratch is simpler than it looks once you break it into steps.
- Define the zone. Mark off the final 60% of the pitch, the opponent's half plus one-fifth of your own.
- Count the numerator. Tally every completed pass the opponent made inside that zone during the match.
- Count the denominator. Tally your team's tackles, interceptions, challenges, and fouls committed inside that same zone.
- Divide. Numerator ÷ denominator equals your PPDA for that match.
Say the opponent completed 88 passes in your pressing zone, and your team logged 8 tackles, interceptions, and fouls combined in that zone. That's 88 ÷ 8, a PPDA of 11.0, right at league-average pressing intensity.
For season-level tracking, most analysts average match PPDA values across all fixtures rather than pooling every event into one giant calculation. Per-match figures are more useful for spotting tactical tweaks; per-season averages are better for describing a team's overall identity.
How Football Planet Helps You Track Pressing Stats
Football Planet surfaces pressing-adjacent numbers alongside match data so you're not stuck guessing at a team's approach mid-game. Pair a PPDA reading with expected goals to see whether a team's high press is actually converting into danger, or just running up the mileage counter. Curious teams to compare? Browse Football Discovery to pull up stats side by side before locking in a call on FP Predictor.
- Check PPDA against opponent PPDA in the same fixture for instant context.
- Use Football Planet's AI assistant to ask follow-up tactical questions after spotting an unusual number.
- Remember that provider variance is real, so keep comparisons within one data source.
Pro Tip: Ask Football Planet's AI Football Assistant to break down why a team's PPDA shifted between two matches. It's a quick way to spot a tactical change without digging through raw event data yourself.
This section draws on editorial analysis from Andris Tukish, with figures sourced from Wyscout, the Premier League, and Hudl's public documentation.
Where PPDA Fits in Modern Tactical Analysis
PPDA earns its place as a fast diagnostic. It tells you, in one glance, whether a team is built to hunt the ball high or sit and absorb. What it can't tell you is whether that hunting actually works. I'd treat any PPDA number as a trigger to go watch the tape, not a standalone grade on a team's defense. The number opens the question. Video and complementary metrics answer it.
Frequently Asked Questions
What does PPDA stand for in football? PPDA stands for "passes per defensive action." It's a pressing intensity metric that divides opponent passes allowed in a target zone by a team's defensive actions in that same zone.
Is a low PPDA always good? Not necessarily. A low PPDA shows a team presses often, but it says nothing about whether that pressing wins the ball back or leads to anything dangerous. Always check complementary stats like turnovers and xG.
Why do PPDA numbers differ between Wyscout and StatsBomb for the same match? Providers use slightly different coordinate boundaries and event definitions. Some include dribbled-past events or blocks in the denominator, others don't, so figures from different sources aren't directly comparable.
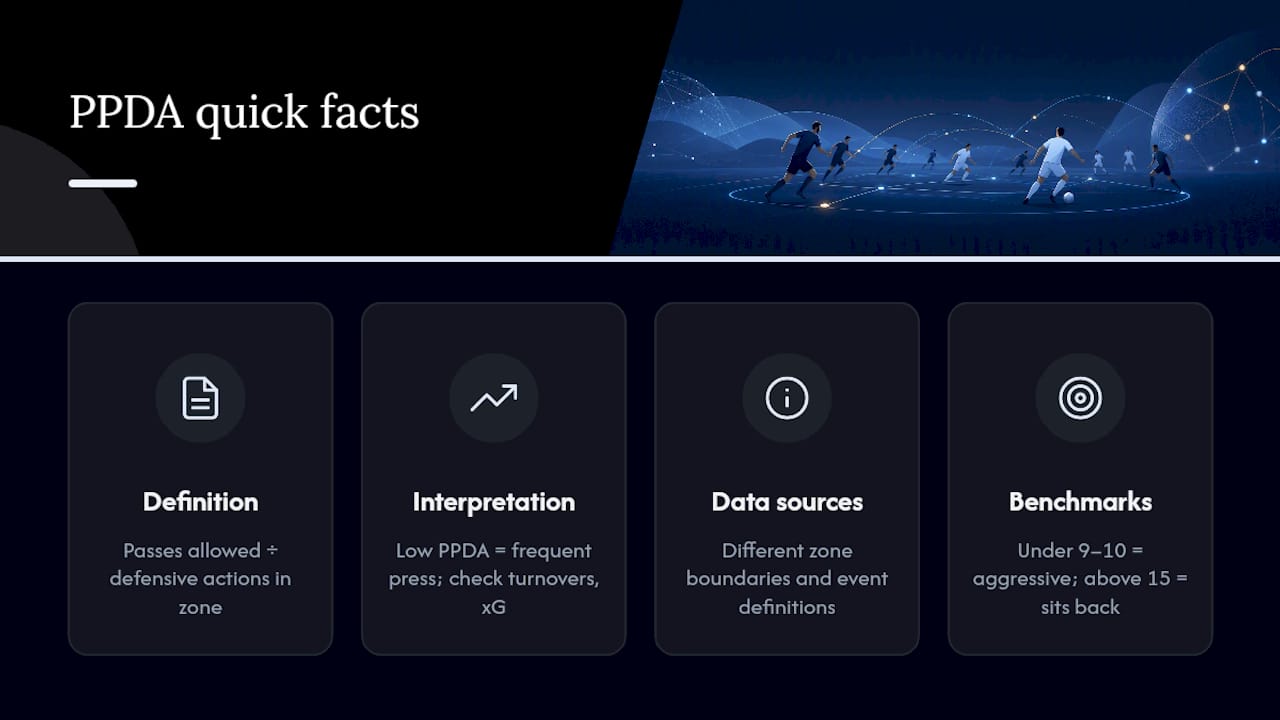
What's considered a good PPDA in professional football? Based on Wyscout's benchmarks from Europe's top five leagues, anything under 9 or 10 signals an aggressive press, while figures above 15 suggest a team that sits back and defends deeper.
Can I calculate PPDA myself from match footage? Yes.
Sources
- PPDA - Wyscout Glossary
- Passes per defensive action: explained — Premier League
- Passes Per Defensive Action (PPDA) • Hudl Support
- What Is PPDA In Football? – Its Definition, Advantages And Disadvantages – Total Football Analysis